Summary
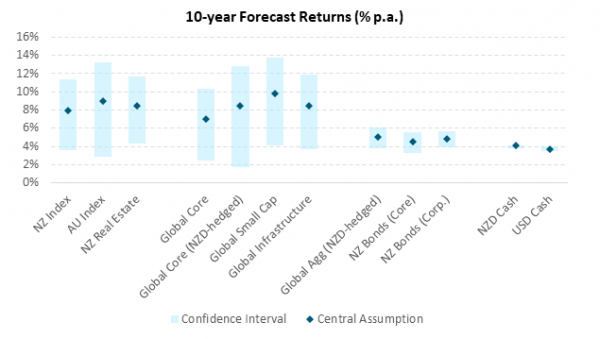
- Investors anchor long-term strategic asset allocation by considering a range of assumptions for key asset classes
- Harbour’s long-term return assumptions are one of many inputs into considering strategic asset allocation across multi asset portfolios, such as conservative, balanced and growth mandates
- Our return assumptions are market valuation aware and, as a result, our most recent forecast is for a narrowing in the return gap between the broad asset classes of equities and bonds
- It is our view that investment selection will be rewarded over the next decade, with a broad array of assets providing attractive returns, in contrast to the recent history of US mega-cap dominance
- Implications for a diversified portfolio are that the proportion of investment return coming from fixed income asset classes should be higher over the coming years, compared to the previous decade
The starting point is important
There are forecasts in this paper which, if we jumped in a time-machine and did this five years ago, would have looked very different. The key reason behind this is that the starting point matters. As we will explore, in the last couple of years we have seen moves in both equity and bond markets that have transported us into a very different place to where we were in 2019.
The fact that money is no longer free means that asset allocation is no longer as simple as maximising allocations to equity markets. Markets will reward a more selective approach to asset purchases.
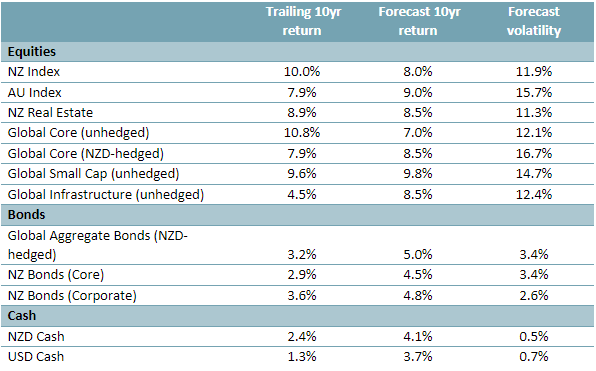
Trailing 10-year period ending 31 December 2023. All returns shown in NZD unless otherwise stated. Reference indices (in respective order): S&P NZX 50 Portfolio Gross Index, S&P ASX 200 Total Return Index, S&P/NZX Real Estate Select Index Gross with Imputation, MSCI ACWI Net Total Return Index, MSCI ACWI 100% hedged to NZD Index, MSCI World Small Cap Net Total Return Index, S&P Global Infrastructure Index, Bloomberg Global Aggregate Total Return Index Hedged NZD, Bloomberg NZBond Composite 0+ Yr Index, S&P/NZX Investment Grade Corporate Bond Total Return Index, NZD Bank Bills 3M Index, US Treasury 3 Month Bill Money Market Index.
Equities
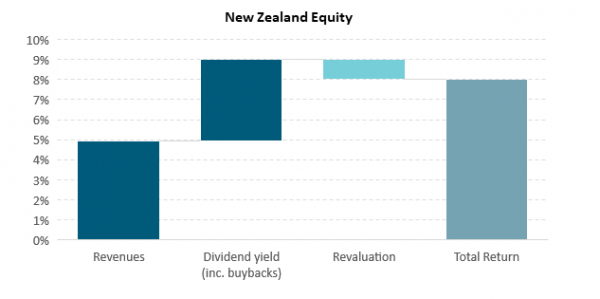
We forecast a marginally higher return from Australian equities (9.0% p.a.) compared to the New Zealand market (8.0% p.a.). This is determined by higher dividend yield and earnings yield estimates. Earnings yield is the inverse of the Price / Earnings (P/E) ratio. At the turn of the year, the New Zealand market was trading at a current earnings yield of 4.5% versus 6.2% for the Australian market. New Zealand Real Estate is marginally higher than New Zealand Index due to trading at cyclical lows in terms of valuation.
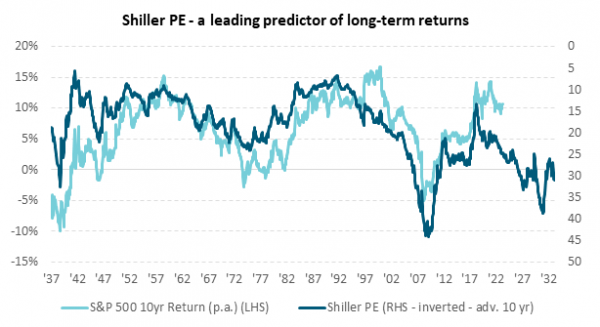
Valuations are an important input to our models. Whilst not necessarily a useful metric for investing over the short term, it is undeniable that there is a correlation between market valuations and long-term equity returns. As an example, we show the Shiller Price/Equity (P/E) ratio for the S&P 500, compared to forward 10-year market returns.
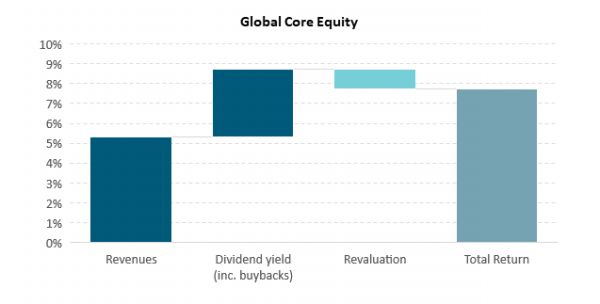
Our forecast return for Global Core Equity is 7.0% p.a., which feels low when compared to the 10-year trailing return of 10.8%. As mentioned above, extended market valuations (compressed earnings yields) are a contributor to this reduced forecast. It is worth noting that, over the past ten years, multiple expansion explains 1.4% p.a. of equity market returns (MSCI All Countries World Index).
For our Global Small Cap forecast return we apply a 2.8% premium to Global Core Equity. This is consistent with historical averages over the last 30 years, but also over the longer term (looking at data from Dimson, Marsh and Staunton where they analyse this effect over nearly 100 years of data). Having said that, there is some cyclicality to the level of premium that small companies demand compared to their larger cap peers. Going back to 1926 it wasn’t until the ‘40s that smaller companies began to outperform in the US, and it was only in the 1970s that they began to really steam ahead of large caps. From 1984-1997 the small cap premium was negative. This was followed by strong small cap performance in the early 21st century with the 10-year premium (MSCI All-Countries World Small Cap vs. MSCI All-Countries World) reaching over 5% p.a. at times both pre- and post-GFC. Since then, it has been a tough decade for small caps with the trailing 10-year premium coming in at -2.1% p.a. This provides some level of support for our forecast with an expected reversion of the small cap premium, as we have seen in the past. Also supportive is the relative level of valuations of small caps versus large caps which, at the turn of the year, was trading at the 5th percentile compared to the previous 20 years.
When it comes to infrastructure, we forecast a 10-year return of 8.5% p.a. which is considerably higher than the 4.5% trailing 10-year return. Valuation support is clear with the relative valuation spread between infrastructure and global equities trading at the 1st percentile over 15 years of historical data, and the category trading at the 27th percentile relative to itself over that same period. Higher starting interest rates are also a factor in our infrastructure forecast, with the companies in this category having a high degree of interest rate sensitivity to their returns (and inflation adjusted incomes) and have historically outperformed global equities in falling interest rate environments.
Forecasting currency hedging premia relies on a forecast for the short-term interest rates of New Zealand and the five largest currencies in the MSCI ACWI Index (USD, JPY, EUR, GBP, CHF). Given New Zealand’s current relatively high short-term interest rates compared to this basket, and historically high rates over 30 years, we forecast that there will be a 1.5% p.a. hedging premium over the next decade. Providing further support for our forecast is the current undervaluation of the New Zealand dollar compared to the US dollar on a PPP (Purchasing Power Parity) fair value basis. Historically the NZDUSD pair has mean reverted to PPP fair value and, should this continue to be the case, then we would expect to see the New Zealand dollar appreciate over the next decade.
Fixed Interest
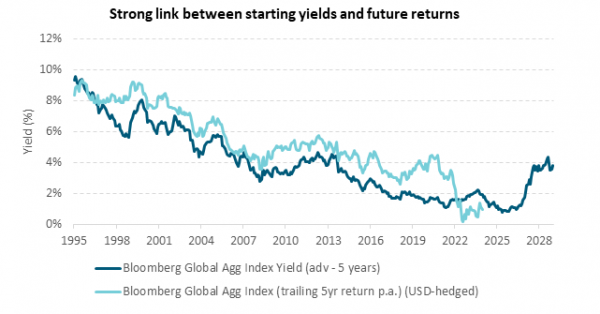
Continuing with our theme of ‘the starting point is important’, we introduce the below chart showing the correlation between starting yields and future returns in the Bloomberg Global Aggregate Index. Starting yields and expected reversion of those yields to forecast levels form a core part of our forecasts for the asset class.
We split our forecast into Core and Corporate for New Zealand Fixed Interest, where Core is a composite of corporate and government bonds. The most relevant indices to consider for these would be the Bloomberg NZBond Composite 0+ Yr Index and S&P/NZX Investment Grade Corporate Bond Total Return Index respectively.
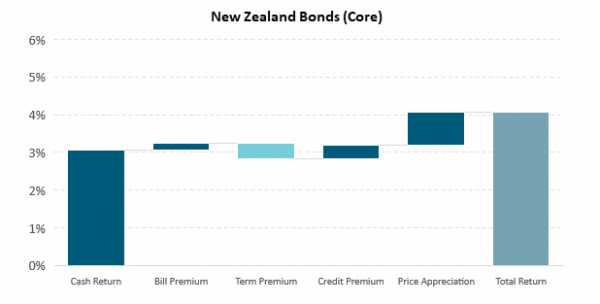
For the Core segment of this asset class, we have a terminal yield assumption of 3.0% (3.3% for Corporate) which, when taken into consideration with current market yields at higher levels, implies some capital appreciation in bonds over the next decade. This is combined with an average yield expectation for each segment to provide part of our forecasts. We also forecast term premia, credit premia, and cash returns to build a bottom-up forecast for the asset class. When combining these we come out with 4.5% for New Zealand Bonds (Core) and 4.8% for Corporate Bonds, both of which are higher than the respective trailing 10-year returns of 2.9% and 3.6%.
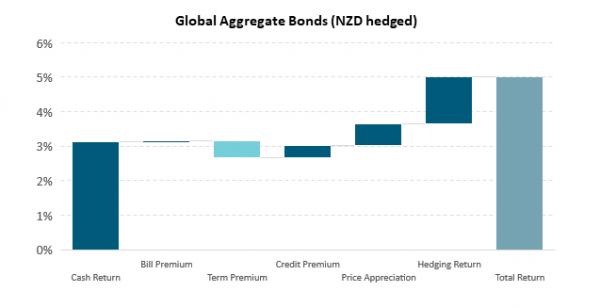
We take a similar approach when creating our forecast for the Bloomberg Global Aggregate Index (NZD hedged). The story globally is similar to New Zealand, with high current yields and expected capital appreciation providing for a strong forecast. For our bottom-up portion it is notable both for global and New Zealand that current deeply inverted yield curves are resulting in a negative forecast for the term premium (which is a combination of current levels and historical). The premium for hedging back to New Zealand dollars is calculated in a similar manner as for equities, however with the appropriate currency basket and weights for the index. Overall, we come out with a 5.0% p.a. forecast for Bloomberg Global Aggregate Index (NZD hedged), and again this is a fair clip higher than the historical 10-year return of 3.2%.
Implications for portfolios
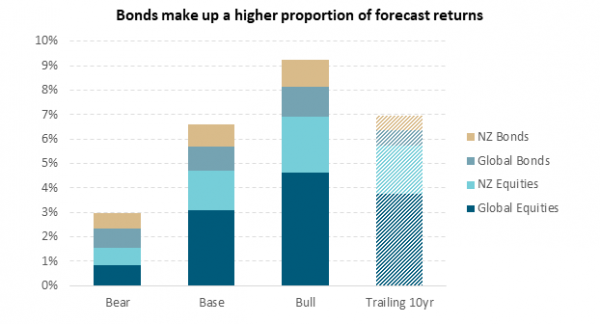
We show forecast returns for a hypothetical 60/40 portfolio, with 40% Global Equities (50% hedged), 20% New Zealand Equities, 20% Global Bonds (NZD-hedged), 20% New Zealand Bonds (Core).
Our base case forecast is calculated using the central forecasts for each asset class. We calculate expected volatility for the portfolio based on historical correlations between the asset classes, then generate bear and bull forecasts through a Monte Carlo simulation approach with 10,000 observations.
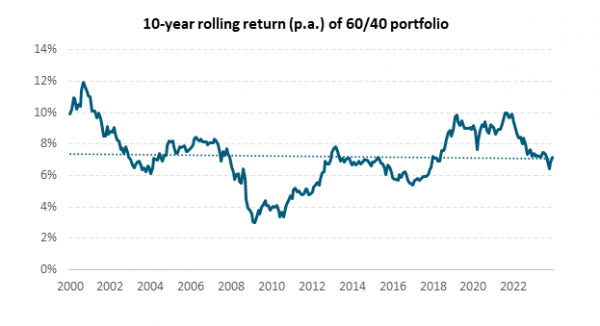
The forecast return for the portfolio (6.6%) is not too changed from the 10-year trailing return (7.0%), but the main differences come in the relative level of contributions to those returns from the different asset classes. The last decade of low (and then rising) rates has meant that equities have far outpaced bonds, meaning that over 80% of the portfolio return over the trailing 10 years was driven by equities. Our current forecasts of slightly lower expected returns from those asset classes, and slightly higher expected returns from bonds has redressed that balance somewhat and we see bonds (both global and New Zealand) contributing much more to returns over the coming years. This is testament to the importance of diversification within portfolios.
Appendix
Here we provide a sample of decompositions of our forecasts for illustrative purposes only. Noting that each asset class forecast is comprised of multiple forecasting methods, not just the ones shown below.
Equities
Fixed Interest
IMPORTANT NOTICE AND DISCLAIMER
This publication is provided for general information purposes only. The information provided is not intended to be financial advice. The information provided is given in good faith and has been prepared from sources believed to be accurate and complete as at the date of issue, but such information may be subject to change. Past performance is not indicative of future results and no representation is made regarding future performance of the Funds. No person guarantees the performance of any funds managed by Harbour Asset Management Limited.
Harbour Asset Management Limited (Harbour) is the issuer of the Harbour Investment Funds. A copy of the Product Disclosure Statement is available at https://www.harbourasset.co.nz/our-funds/investor-documents/. Harbour is also the issuer of Hunter Investment Funds (Hunter). A copy of the relevant Product Disclosure Statement is available at https://hunterinvestments.co.nz/resources/. Please find our quarterly Fund updates, which contain returns and total fees during the previous year on those Harbour and Hunter websites. Harbour also manages wholesale unit trusts. To invest as a wholesale investor, investors must fit the criteria as set out in the Financial Markets Conduct Act 2013.

