Recently one of the world’s largest companies posted earnings. Nvidia has been more than just a market darling, it has epitomised the concentration of stocks in the global equity index. Rising from a fraction of a percent, Nvidia now stands at over 6% of the S&P 500 index which is comprised of larger capitalisation US stocks. Collectively the top ten stocks account for some 37% of that market, when a decade ago the top ten stocks were only 18%. Perhaps even more notable is that the top three stocks alone almost total 20% of the index.
Today's US equity market concentration, while high, is not unprecedented. Similar levels of concentration were seen in the early 1960’s, led by telecommunications company AT&T, General Motors and mainframe computing pioneer IBM. When studying history, the level of market concentration does not provide many clues to future returns, however one observation we can make is that market returns have been higher during periods of rising concentration vs. falling concentration.
According to analysis by Morgan Stanley, in the three main incoming tides of rising concentration since 1950, the US equity market provided returns of 16.4%, 23.5% and 12.0% per annum, compared to the lower returns when concentration fell of 10.5% and 3.6% per annum. The latter period spanned from the early 2000’s through to the early 2010’s when concentration fell due to the sharp fall in mega cap technology stocks such as Microsoft, AT&T and Cisco following the bursting of the tech bubble in 2000 and 2001.
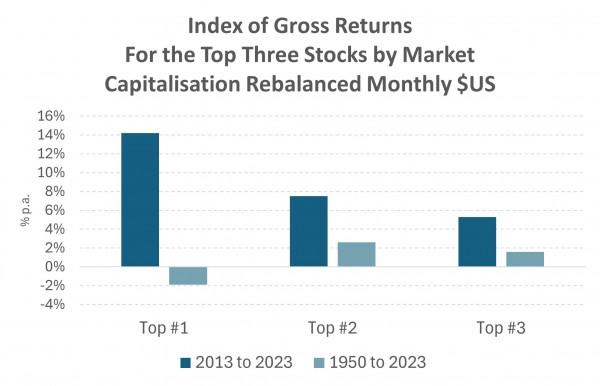
Indeed, investing in the largest stocks in the market has not been a winning strategy. From 1950 to 2023, investing in the largest stock would have resulted in underperformance compared to the broader market, while investing in the Top 2 and Top 3 names would have resulted in outperformance, however this is skewed by strong outperformance from the top stocks over the past ten years.

Source: Morgan Stanley
As covered in books such as “The Innovator's Dilemma: When New Technologies Cause Great Firms to Fail, by Clayton Christensen” larger companies tend to lose their dominant positions due to their failure to innovate and losing market dominance as new technologies emerge. However, the companies which have asserted dominance over the last decade have done so during periods of technological change and it could easily be argued recently that mega cap companies have developed stronger foundations as technology such as generative AI have emerged.
Interestingly when we compare the top 10 companies of today versus a decade ago, some characteristics are striking. While a decade ago, all but one company paid a dividend yield of 2% or more, today, just one of the top 10 companies pays a dividend yield of more than 1%. Sure, buybacks are more prevalent today, but the key difference with today’s larger companies, perhaps taking heed of “The Innovators Dilemma”, are investing through research and development to grow and strengthen their dominant market positions. Amazon, Google, Microsoft and Meta combined are forecast to spend over US$400m on capital expenditure and R&D this year. These four companies spend more than 35% of the total investment capital outlays of stocks listed in the US market.
So, while we should be wary that investing in bigger hasn’t always been better, we need to acknowledge the rarity of the current cohort of mega company’s earnings growth trajectories has been at a significantly faster pace compared to the more mature companies of a decade ago such as Exxon Mobil, Johnson & Johnson, General Motors, Chevron and others.
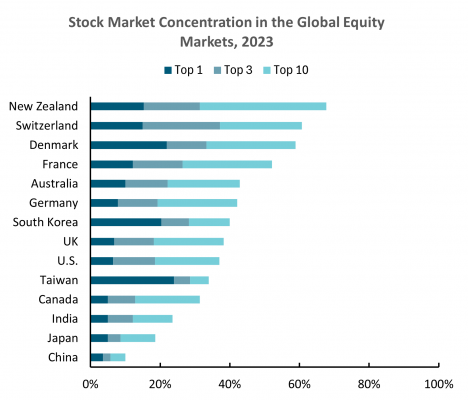
However, the US is not the only concentrated market. In fact, Switzerland, Denmark, France, Australia, Germany and the UK have much higher market concentration than the US. At the other end of the spectrum emerging markets like India and China tend to be a lot less concentrated in the size of listed stocks.

Source: Bloomberg, Harbour
What is stark is the concentration of the top ten stocks in New Zealand. In part that’s a reflection that we use an index of only 50 stocks as our core index. At the other end of the spectrum, Japan’s leading index, the Topix, has nearly 2,000 constituents. Today, Toyota accounts for 3.9% of that market. In New Zealand Fisher & Paykel Healthcare is more than 15% of the New Zealand index, with the top ten stocks today accounting for nearly 68% of the market.
That’s not unusual for the New Zealand market. Back in 2005, Spark was 25% of the local market, while a2 milk also reached 14% of the market in 2019. The performance trend in the New Zealand market of out-performance reversal at times of increasing concentration and vice versa hasn’t played out the same way. In part that’s because the rising dominance of particular stocks has tended to be very idiosyncratic and stock specific. A2 milk’s rise reflected a sharp acceleration of revenue and earnings growth through 2017-2019. More recently Fisher & Paykel’s increased index weighting has reflected the combination of a sequence of positive revenue and earnings surprises while domestically focussed stocks have faltered with depressed earnings.
Owning the largest stock in the New Zealand market has historically provided a mixed return for investors. If you held Spark, Fletcher Building or a2 milk through the peak years of their market exposures, the subsequent years returns for that largest stock has been poor. But that observation has all the hindsight bias of the stock price performance itself creating the peak in exposures.
A better approach for investing is to consider the actual economic profit or earnings relationship to concentration. If today’s market leaders continue to demonstrate strong return on equity, and upgrades to revenues and profits, it would seem more rational to think that concentration itself isn’t a factor to be feared.
IMPORTANT NOTICE AND DISCLAIMER
This publication is provided for general information purposes only. The information provided is not intended to be financial advice. The information provided is given in good faith and has been prepared from sources believed to be accurate and complete as at the date of issue, but such information may be subject to change. Past performance is not indicative of future results and no representation is made regarding future performance of the Funds. No person guarantees the performance of any funds managed by Harbour Asset Management Limited.
Harbour Asset Management Limited (Harbour) is the issuer of the Harbour Investment Funds. A copy of the Product Disclosure Statement is available at https://www.harbourasset.co.nz/our-funds/investor-documents/. Harbour is also the issuer of Hunter Investment Funds (Hunter). A copy of the relevant Product Disclosure Statement is available at https://hunterinvestments.co.nz/resources/. Please find our quarterly Fund updates, which contain returns and total fees during the previous year on those Harbour and Hunter websites. Harbour also manages wholesale unit trusts. To invest as a wholesale investor, investors must fit the criteria as set out in the Financial Markets Conduct Act 2013.