Is there really anything better than a 60/40 portfolio?
The future of wealth is shaped by a new generation of investors - bringing new thinking, expectations, and standards. Across this four-part series, Harbour delves into the evolving landscape and strategies for generating customer value, poised to be the primary catalyst for both present and future transformations in the sector.
In part four, Portfolio Manager, Chris Di Leva, shares the top three lessons when considering branching out from the more traditional 60/40 portfolio into alternative asset classes.
Since 1951 New Zealand equities and bonds have delivered negative returns in the same year just four times. At face value, this seems palatable for a longer-term investor, however when one looks through the rear vision mirror and sees returns of 2.4% p.a for New Zealand bonds and 3.0% p.a for global bonds over the last decade, a logical question might be: what can we do in portfolios that can give us better returns? Or at the very least, a smoother ride?
This question is by no means new, though one that Kiwi investors have not needed to explore with the same urgency as, say, European or Japanese investors who, thanks to having near zero interest rates for more than a decade, have had to re-examine the merits of the 60/40 portfolio and introduce different asset classes into portfolios. As Kiwi investors there is plenty we can learn from their experience, particularly as we see the emergence and availability of some of these asset classes increase for domestic investors.
Here are the top three lessons when considering branching out from the more traditional 60/40 portfolio into alternative asset classes.
1. Be careful with the trade-off between alpha and beta
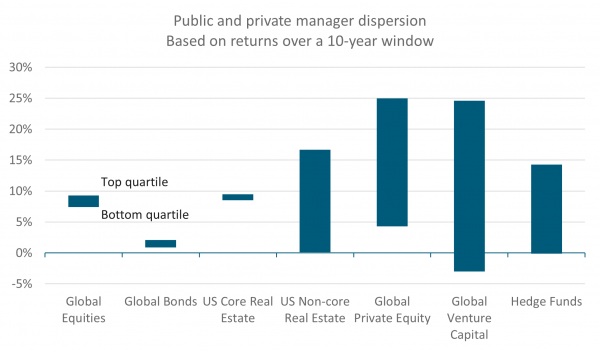
Lower expected returns from bonds, alongside worries about equity concentration risk, have led many investors towards alternative investments. In essence, this has been a trade-off between a return dominated by beta (i.e. the market) to one driven by alpha (i.e. the ability of a manager to create excess returns). This gives rise to heightened manager selection risk.
Manager selection always matters, and when it comes to alternative investments choosing a great manager is crucial. As can be seen below, the inter-quartile range (the gap between a top quartile manager and bottom quartile manager) for hedge funds is 14.7%, while global private equity and venture capital stand at 20.7% and 27.6% respectively. Global equities and global bonds by comparison have more paltry inter-quartile ranges of 1.9% and 1.2% p.a..
Bottom line, there is a much higher cost to picking the wrong alternatives manager compared with picking the wrong equity or bond manager. Governance focus, expertise and budget need to be adjusted to reflect this.

Source: Burgiss, NCREIF, Morningstar, PivotalPath, J.P. Morgan Asset Management
2. Listed markets are shrinking and that has implications for portfolios
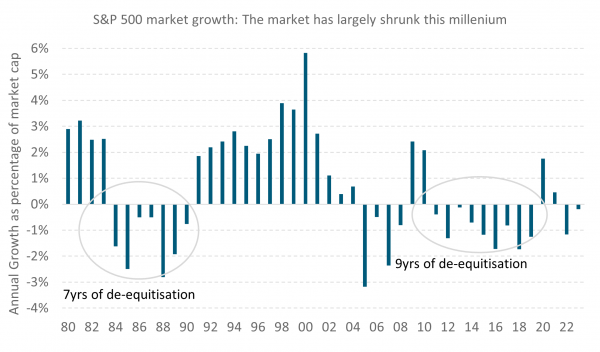
One underappreciated fact is that the number of listed companies one can invest in is shrinking. For example, the Wilshire 5000 Index (which aimed to capture the entire US market) was home to some 7500 companies in 1998, and today contains around 3500 companies. The S&P 500, the world's largest equity market by some distance, has shrunk when adjusting for price growth as stock buybacks, privatisations and lack of listings have hit the market. As can be seen below, this is a persistent trend of the post-dotcom era.

Source: MST Marquee.
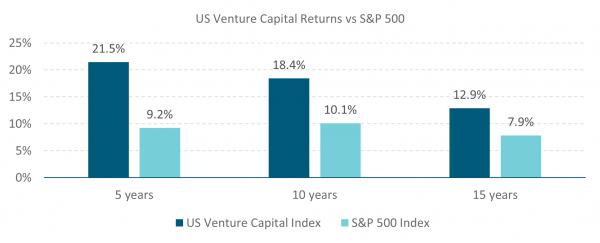
So, what is happening to these companies? They are remaining private for longer, leading to a burgeoning venture capital market in the US which has delivered strong returns to investors as can be seen below. Clearly there are issues in making true like-for-like comparisons between listed and private markets such as reinvestment risk, self-selection bias, price discovery, etc, however, even adjusting for that, the below figures look impressive.

Source: Bloomberg, Cambridge Associates. VC returns are shown net of all fees. Public market indices are shown gross.
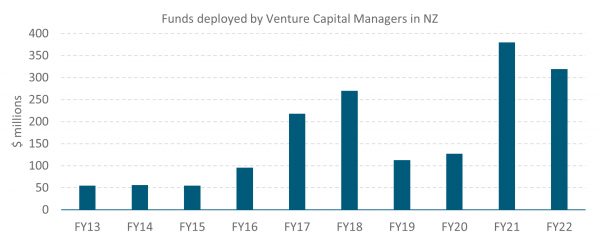
New Zealand has not been immune from this trend with our own venture capital industry growing considerably in recent years. Funds are now being raised in greater scale, with managers such as Movac (a mainstay in the scene for some time), Global from Day One, Icehouse Ventures, Blackbird and Hillfarrance all raising funds in New Zealand over the past few years. This has been driven by two things, firstly the support from the Government-backed Elevate Fund. Secondly, by some success stories such as Trademe, GreenButton, PowerbyProxi, Timely, Aroa and Vend who all are recent examples of venture capital-backed companies. We believe the structural trends evident and potential for excess returns make this an attractive asset class worthy of consideration.

Source: EY New Zealand Private Capital Monitor 2023
3. Apply the “why does this opportunity exist” test
When looking at new investment opportunities, a key question to ask is “is this a genuine excess return opportunity, or is it simply driven by taking more risk?” To have confidence that we are harvesting a structural premium we want to understand the drivers of return. Is it driven by regulation? Is it driven by scarcity of capital? How much of it is driven by illiquidity or taking more risk?
These are some of the questions we asked ourselves as early investors in the Australasian private credit market. In a period where bonds have provided low to negative returns, private credit has stood out for its high returns. According to Preqin, an authority on private credit, US private credit delivered a 12.1% annualised return over the four years to 2021, significantly above the 5.0% return from public bonds of the S&P 500 constituents in the same period.
An obvious source of outperformance relative to bonds is the much shorter duration in private credit, a predominantly floating-rate market. Illiquidity and lower credit quality play significant roles too. However, even adjusting for these factors, we can make a case for a risk-adjusted premium. Nuanced changes to how much capital Australasian banks have had to allocate to various types of lending has seen them adjust lending rates to some sectors, and even outright retrench in others. In one niche example, asset-backed lending, the banks used to be able to ascribe internal credit ratings that would determine the amount of capital held against loans, and hence their profitability. Bank rules now prohibit this. In a market historically dominated by banks and with a relatively under-developed private credit sector, this scarcity of capital can lead to opportunities for private credit to fund the same risk banks used to, but at wider margins.
However, it is a small market and themes can eventually become crowded. We are wary of managers who have accumulated piles of cash and are incentivised to deploy capital with less regard to the quality of lending. The private credit asset class has a wide span, from distressed lending to direct bilateral SME lending. While we have found opportunities in the broader asset class, our enthusiasm is not universal. Indeed, we have previously warned that capital flows into global leveraged loans have led to a watering down of covenants that protect lenders.
IMPORTANT NOTICE AND DISCLAIMER
This publication is provided for general information purposes only. The information provided is not intended to be financial advice. The information provided is given in good faith and has been prepared from sources believed to be accurate and complete as at the date of issue, but such information may be subject to change. Past performance is not indicative of future results and no representation is made regarding future performance of the Funds. No person guarantees the performance of any funds managed by Harbour Asset Management Limited.
Harbour Asset Management Limited (Harbour) is the issuer of the Harbour Investment Funds. A copy of the Product Disclosure Statement is available at https://www.harbourasset.co.nz/our-funds/investor-documents/. Harbour is also the issuer of Hunter Investment Funds (Hunter). A copy of the relevant Product Disclosure Statement is available at https://hunterinvestments.co.nz/resources/. Please find our quarterly Fund updates, which contain returns and total fees during the previous year on those Harbour and Hunter websites. Harbour also manages wholesale unit trusts. To invest as a wholesale investor, investors must fit the criteria as set out in the Financial Markets Conduct Act 2013.
