The Harbour Social Spotlight is a three-part series summarising our recent research project into ESG-related issues.
- Employee engagement, among larger NZX-listed corporates, was assessed through company reports and a survey.
- We found a low level of disclosure on employee engagement scores, turnover and absenteeism with comparability between companies difficult.
- The majority of companies that did disclose showed improvements in their employee engagement scores and turnover, but not absenteeism.
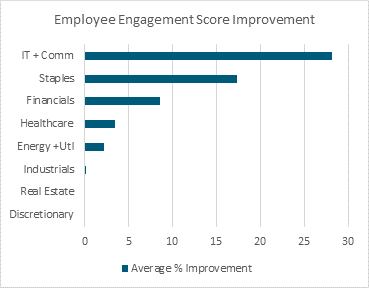
- Sector dispersion is evident with the IT, Communication and Consumer Staples companies showing the greatest improvement in employee engagement surveys.
Introduction
Social considerations have risen in prominence particularly over the last year with the heightened focus on the health and wellbeing of company stakeholders given the COVID-19 pandemic. Human capital, as opposed to physical capital, has been more difficult to measure and capture using traditional accounting treatment, however, there has been growing evidence of the significance of human capital’s contribution to business performance.1,2 A market study has shown the proportion of intangible assets in the S&P500’s market value has grown from 17% in 1975 to 90% in 20203.
Employee engagement forms a critical part of this and underlying metrics that attempt to measure this include employee engagement surveys, voluntary turnover and absenteeism. Other aspects that could be classified under human capital management such as diversity and occupational health and safety will be covered separately in the next edition of our social spotlight.
As part of our research project into social considerations by Harbour intern, Purvai Gupta, we investigated the state of the New Zealand market in terms of human capital management through information provided by companies in their annual filings, as well as engaging with a sample of them directly with a survey. The desktop analysis spanned the S&P/NZX50 constituents, while the survey sample covered 20 of the largest of these companies. We sought information on the type of employee engagement survey they use (if any), how the scores have been tracking and data on their voluntary turnover and absenteeism rates.
Employee engagement
There are many different ways that companies measure engagement or satisfaction levels of their employees; some use internal surveys and others use prevalent industry ones such as Peakon, Culture Amp and Qualtrics. They are typically measured through an engagement score via annual and pulse surveys taken through the year. Common questions the surveys are centred on are the employees’:
- Experience in the company
- Perception of being valued
- Likelihood of recommending the organisation as a good workplace
They aim to assess how well an employee fits in an organisation and how involved an organisation is in the wellbeing of its employees.
We have assessed the overall engagement score as a comprehensive indicator, although they can often be broken down by section and assessed separately. Our study showed that less than half of the S&P/NZX50 (20 companies) publicly reported their actual engagement scores or provided them through our survey, but most did mention they had some form of engagement boosting policies. From the companies with available information and consistent survey criteria, just over 60% showed an improving trend in their scores. Only one company showed a regression in score, with the rest all remaining stable. However, it is important to note the wide variety of different surveys available, making comparisons difficult.
At a sector level, disclosure rates tended to vary with companies classified under Consumer Discretionary and Real Estate not reporting any employee engagement scores, though most mentioned having engagement practices in place. Results showed the most improvement in employee engagement in the IT and Communications sectors, although the Consumer Staples sector had the most companies making improvement.


Turnover
Abnormally high levels of voluntary employee turnover can be a warning signal of poor labour treatment and employee dissatisfaction. Voluntary turnover as opposed to total turnover is a more relevant measure of engagement given it excludes staff who are dismissed or made redundant, which can be heavily influenced by external factors such as economic conditions.
Staff turnover has both upfront cash costs and implied costs especially from voluntary departures where replacements are necessary. The upfront costs include recruitment fees, induction, and training costs in addition to the time and resources required from management, HR and other employees. There are also implied costs such as the decline in productivity as the new employee upskills in the position and lost knowledge and skills from the departed staff member. The consensus from academic research has estimated the total cost of recruiting and training new employees to be approximately 150% of their annual salary5,6. This shows the importance of retaining talent within a business and keeping engagement levels high.
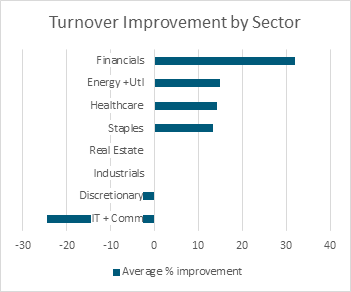
There was a low rate of public disclosure of turnover data from companies with less than a quarter of the market (11 companies) reporting this information, however we were able to collect data from 10 additional companies through our survey. Most companies also did not distinguish between voluntary and involuntary turnover, only providing a total figure. The Consumer Discretionary sector showed the highest rate of employee turnover, while energy and utility companies were lowest. In terms of the trend over time, from those that did disclose, the majority (80%) showed an improvement as a reduced total turnover rate. The Consumer Discretionary, IT and Communications sectors showed negative trends in their total turnover although this was likely impacted from the COVID-19 induced circumstances.


Absenteeism
Another measure related to turnover is staff absenteeism, the rate of unscheduled absences of employees compared to total scheduled working days. This includes absences due to sick leave or unapproved leave and while, to some extent, a certain degree of absenteeism is inevitable as staff become ill or need to take care of family members, poor health and wellbeing practices can lead to higher rates of absences due to preventable causes such as work-related injuries, stress or low morale.
There is a financial burden to absenteeism, with New Zealand averaging 4.7 days of absence per employee in 20187. This represents a cost to employers of close to $1,000 per annum for a typical employee or $1.8 billion across the NZ economy7. Although the main drivers of absence in New Zealand tend to be from non-work-related illness or caring for family members, there is not an insignificant amount of respondents in a market survey that list mental wellbeing/stress and non-illness related reasons for causes of absence.
From our analysis among the S&P/NZX50 listed companies, only six companies publicly reported their absenteeism rate, although several mentioned they did record this for internal evaluations. We were able to collect the most recent absenteeism rates from an additional six companies through our survey but not the historic trend. From the publicly reported rates, only two companies showed improvements in their absenteeism, three regressed and one was stable.

Conclusion
Investors are increasingly interested in environmental, social and governance (ESG) considerations that can influence company performance and we believe that human capital management can be used as a leading indicator. It provides insight into management quality and can lead to clear, positive financial outcomes such as lower costs associated with replacing staff.
Our research into measures of human capital management across the New Zealand listed market has shown the lack of disclosure in general, due to either insufficient measurement or companies preferring to keep the information confidential. There is also the lack of comparability between companies given the absence of a standardised survey to measure employee engagement or failure to distinguish between voluntary and involuntary turnover.
However, for the companies that did report this information, many showed encouraging progress across these metrics over time, reflecting their strong health and wellbeing cultures that include practices such as flexible working arrangements and employee assistance programmes.
At Harbour, we have long considered these factors in our ESG research programme through our Corporate Behaviour Survey, our main tool for assessing ESG competency, and we believe that social considerations such as these will continue to be important value drivers for companies and issues of concern for investors going forward.
References
- Ngoc Phu Tran & Duc Hong Vo | Collins G. Ntim (Reviewing editor) (2020) Human capital efficiency and firm performance across sectors in an emerging market, Cogent Business & Management, 7:1, DOI: 1080/23311975.2020.1738832
- Samad, S. (2013). Assessing the Contribution of Human Capital on Business Performance. International Journal of Trade, Economic and Finance, 393-397.
- Intangible Asset Market Value Study | Ocean Tomo
- Bliss, W. G. (2001). Cost of employee turnover can be staggering. Fairfield County Business Journal, 40(19), 20-21.
- Hansen, F. (1997). What is the cost of employee turnover? Compensation and Benefits Review, 29(5), 17-18.
- Phillips, J. D. (1990). The price tag on turnover. Personnel Journal, 69(12), 58-61.
- 2019 Workplace Wellness Report, Southern Cross Health Society and BusinessNZ
IMPORTANT NOTICE AND DISCLAIMER
Harbour Asset Management Limited is the issuer and manager of the Harbour Investment Funds. Investors must receive and should read carefully the Product Disclosure Statement, available at www.harbourasset.co.nz. We are required to publish quarterly Fund updates showing returns and total fees during the previous year, also available at www.harbourasset.co.nz. Harbour Asset Management Limited also manages wholesale unit trusts. To invest as a Wholesale Investor, investors must fit the criteria as set out in the Financial Markets Conduct Act 2013. This publication is provided in good faith for general information purposes only. Information has been prepared from sources believed to be reliable and accurate at the time of publication, but this is not guaranteed. Information, analysis or views contained herein reflect a judgement at the date of publication and are subject to change without notice. This is not intended to constitute advice to any person. To the extent that any such information, analysis, opinions or views constitutes advice, it does not take into account any person’s particular financial situation or goals and, accordingly, does not constitute financial advice under the Financial Markets Conduct Act 2013. This does not constitute advice of a legal, accounting, tax or other nature to any persons. You should consult your tax adviser in order to understand the impact of investment decisions on your tax position. The price, value and income derived from investments may fluctuate and investors may get back less than originally invested. Where an investment is denominated in a foreign currency, changes in rates of exchange may have an adverse effect on the value, price or income of the investment. Actual performance will be affected by fund charges as well as the timing of an investor’s cash flows into or out of the Fund.. Past performance is not indicative of future results, and no representation or warranty, express or implied, is made regarding future performance. Neither Harbour Asset Management Limited nor any other person guarantees repayment of any capital or any returns on capital invested in the investments. To the maximum extent permitted by law, no liability or responsibility is accepted for any loss or damage, direct or consequential, arising from or in connection with this or its contents.
