- The RBNZ has started its easing cycle and markets expect much more, taking the OCR to 3% in one year’s time.
- Lower interest rates should boost economic activity, while higher council rates and insurance costs are likely to provide an offsetting force.
- Household experiences of lower interest rates will differ greatly, depending on respective financial situations. We think those with debt are likely to benefit most from a cash flow point of view. Those with large amounts of assets are likely to experience an improved balance sheet position, but may experience a drop in income derived from financial assets. The cohort of households with no debt or assets should still benefit from a more prosperous economy.
We all know lower interest rates are good for economic activity, but what isn’t discussed as much is how different the individual household experience is likely to be. In this note we examine this through the lens of three simplified households which each make up about one third of total – renters, those without a mortgage and those with one.
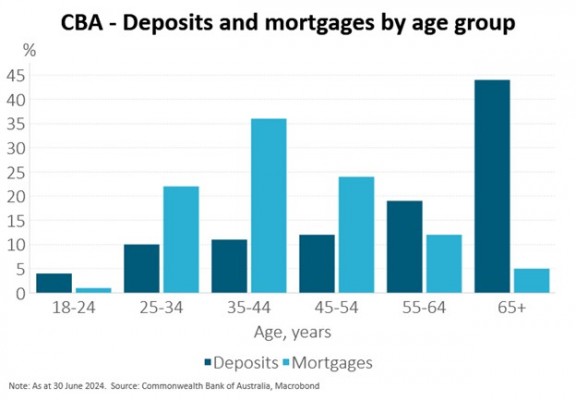
One of the most detailed breakdowns of household mortgage and deposit exposures was presented by Commonwealth Bank of Australia (CBA) in its annual result presentation. CBA led its 2024 investor presentation with three pages of data highlighting that both tightening and easing cycles impact households unevenly. For instance, the chart below shows exposures to mortgages and deposits across CBA’s book of business.

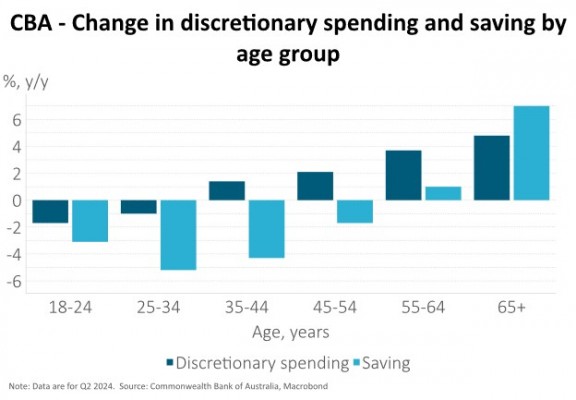
Turning to our thesis, in New Zealand hardly anyone is immune from the increases in council rates, insurance and general cost of living. As we discussed earlier this year, the increase in New Zealand living costs since the end of 2019 were, fortunately, matched by a broadly equivalent increase in household income on average (see Harbour Navigator: New Zealand households to remain challenged). However, that only allows for consumption remaining the same, rather than growing, while we know there are important distributional effects. Higher costs of living tend to have the greatest impact on those households with low incomes. Indeed, CBA data for Q2 support this with younger people showing the greatest annual reduction in discretionary spending (see chart below).

In the case of council rates and insurance, homeowners will experience these forces most directly, and landlords will likely attempt to pass these costs on to renters over time. Statistics NZ data for household expenditure shows in 2023, the average household spent $330 per month on council rates and, likely due to underinsurance, just $83 per month on insurance. Applying the 12 and 13% respective annual increases reported by Statistics NZ in the Q3 CPI data, results in a combined $50 per month increase. This will differ greatly by region, however. In Wellington, for example, we estimate average council rates and insurance costs have increased around 20% over the past year or a combined $140 per month.
With time, everyone should benefit from the improved economic prosperity that lower interest rates are likely to bring. This includes greater job security and higher wage growth. The impact on intertemporal consumption choices is also likely to be felt by all, as lower interest rates reduce the incentive to delay spending. The table below summarises our results.
Summary table: Impact on monthly income – today vs. one-year ago:
|
Representative Household |
Renter |
Mortgage-free homeowner |
Mortgagee |
|
|
Description |
We assume they are debt free and do not own financial assets |
We assume all financial wealth is held by mortgage-free homeowners |
‘Average’ mortgage holder (LVR 42% and 23-year term to maturity) |
New home buyer (LVR 80% and 30-year term to maturity) |
|
Impact of lower interest rates |
Indirectly positive impact via a stronger economy and more affordable housing. |
Investment (term deposit) earnings fall $650 per month, $530 after tax |
$110 less cost per month |
$460 less cost per month |
|
Impact of higher insurance and council rates |
Eventually these may be passed on via rent. |
$50 cost increase per month |
$50 cost increase per month |
$50 cost increase per month |
|
Net impact on cashflow |
Individuals may be worse off if landlords can pass on higher council rates and insurance costs to rents, but higher wage growth over time should provide some offset. |
$700 drop in net income per month or $580 drop, after tax |
$60 increase in net income per month |
$320 increase in net income per month |
1. The debt-free renter
The impact of lower interest rates for this household is largely through an improved economic outlook which, for example, should bring with it improved job security and, eventually, higher rates of wage growth.
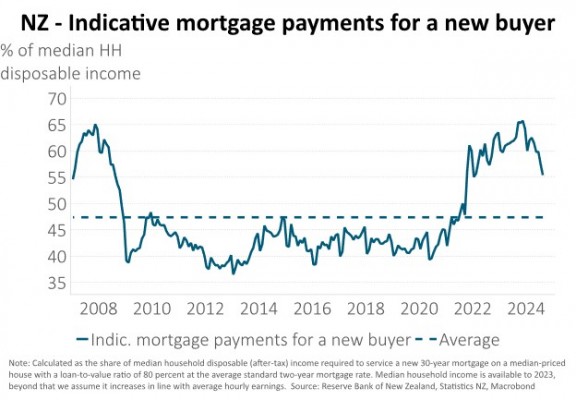
For those considering becoming a homeowner, lower mortgage rates are likely to improve the affordability of houses. We estimate that more than 65% of household income was needed to service an average new mortgage at the end of last year, versus an average of less than 50% since 2007, but that has now dropped to 55% and should continue to decline (see chart below).

2. The mortgage-free homeowner, who also owns some financial assets
The greatest impact of lower interest rates for this household is likely to be via a drop in income derived from financial assets. The median house price is about $780,000. Data on household wealth tells us that, on average, it is split equally between non-financial and financial assets. Therefore, we assume this household has an equivalent amount of financial assets, giving it a total wealth of $1,560,000.
The RBNZ expects house prices to increase about 5% per annum over the coming 2-3 years, as interest rates fall, which is not too different to the average economist forecast. Earlier this year we published our long-term investment return assumptions (see Harbour Investment Horizon: Long Term Investment Return Assumptions). Our expectation of annual bond returns is roughly equivalent to current running yields, which are 4-5%. Term deposit interest rates are expected to be similar over this period. For equities, returns are likely to be higher than bonds at 7-8%.
To the extent that these financial asset returns are lower than 2023 and 2024 YTD, there may be a negative income effect for this type of household if the returns are being treated as income via regular withdrawals. To put some numbers around it, let’s assume income is derived from the total return of the financial assets which are allocated 60% to equities (40% global and 20% NZ) and 40% to bonds (25% global and 15% NZ). Based on the return assumptions above, this portfolio returned 18% over the past year but is likely to return 7% per annum going forward. In dollar terms, that’s a drop from $143,000 of return to $54,000 for this household.
A more useful example may be a household with all its financial assets in an income-generating investment. If we assume this is a 1-year term deposit, these rates have dropped from 6.1% to 5.1% over the past year. This represents a drop in pre-tax annual income of $7,820 ($47,600 to $39,780) or $650 per month. Assuming this is the only income for the household, split between two people with no KiwiSaver contributions, post-tax annual income drops by $6,320, from $40,690 to $34,370 or $530 per month. Current term deposit rates imply 1-year rates will decline a further 60bp over the next year.
Let’s now consider the wealth effect and assume it relates only to housing wealth, which is generally found to have a stronger relationship with consumption than financial wealth.[1] The $39,000 gain in the value of the house in this example would increase annual consumption by just $780, or $65 per month, according to RBNZ research in 2019 which suggested that, for every $1 increase in house prices, households increase consumption by 2 cents.[2] Most academic studies find that changes in housing wealth have their largest impact on consumption immediately, with the impact greatly diminished after two to three years.[3]
3. The mortgaged homeowner with negligible financial assets
For this household, it will also experience the positive housing wealth effect outlined above and the largest impact of lower interest rates will be the reduction in debt-servicing costs. We assume the average Loan-to-Value Ratio (LVR) is 42% and the average term to maturity is 23 years[4]. Assuming this borrower owns a median-priced house of $780,000 and is fixing on 1-year special mortgage rates, the 110bp drop to 6.2% over the past year has decreased monthly mortgage payments by almost 5% from $2350 to $2240, a gain of $110 per month.
The benefit of lower mortgage rates is far greater for new home buyers. Let’s assume a median-priced house of $780,000 with a 20% deposit, a 30-year term to maturity and fixing on 1-year special rates. The 110bp drop in mortgage rates translates to a fall in monthly repayments from $4280 to $3820, a $460 per month gain.
[1] See Caceres, C. (2019) “IMF Working Paper: Analyzing the Effects of Financial and Housing Wealth on Consumption using Micro Data” WP/19/115.
[2] See de Roiste, M, Fasianos, A., Kirkby, R. and Yao, F. (2019) “Household Leverage and Asymmetric Housing Wealth Effects – Evidence from New Zealand” DP 2019/01.
[3] See Case, K. E., Quigley, J. M., Shiller, R. J. (2005) “Comparing Wealth Effects: The Stock Market versus the Housing Market” Advances in Macroeconomics, Volume 5, Issue 1, Article 1.
[4] These assumptions are based on data from the Westpac covered bond programme that includes a pool of almost 32,000 NZ mortgages.
IMPORTANT NOTICE AND DISCLAIMER
This article is provided for general information purposes only. The information provided is not intended to be financial advice. The information provided is given in good faith and has been prepared from sources believed to be accurate and complete as at the date of issue, but such information may be subject to change. Past performance is not indicative of future results and no representation is made regarding future performance of the Funds. No person guarantees the performance of any funds managed by Harbour Asset Management Limited.
Harbour Asset Management Limited (Harbour) is the issuer of the Harbour Investment Funds. A copy of the Product Disclosure Statement is available at https://www.harbourasset.co.nz/our-funds/investor-documents/. Harbour is also the issuer of Hunter Investment Funds (Hunter). A copy of the relevant Product Disclosure Statement is available at https://hunterinvestments.co.nz/resources/. Please find our quarterly Fund updates, which contain returns and total fees during the previous year on those Harbour and Hunter websites. Harbour also manages wholesale unit trusts. To invest as a wholesale investor, investors must fit the criteria as set out in the Financial Markets Conduct Act 2013.
