- Despite a 12% decline from last year’s peak, we think New Zealand houses are still significantly overvalued based on historically high price-to-income ratios and mortgage repayment costs.
- The currently tight labour market is usually a positive influence on house prices but is currently being overwhelmed by very low rates of population growth, high mortgage rates and ongoing increases in housing supply. We expect this dynamic to continue in coming months which may result in further house price declines into 2023.
- A more benign scenario for the housing market could occur if house affordability slowly improves via ongoing income growth, reducing the pressure for house prices to fall.
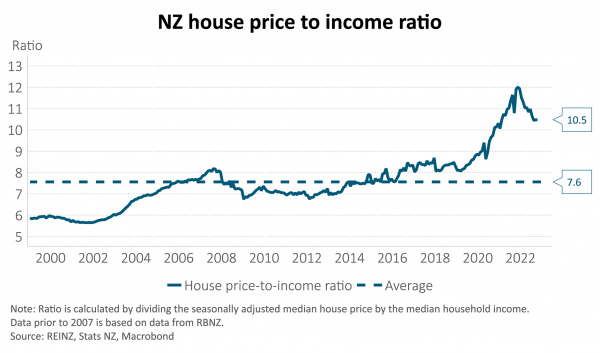
Determining a fair value for house prices is imprecise and most measures don’t adjust for the improvement over time in the quality of houses. A popular metric is the house price-to-income ratio. This has trended higher over the last 25 years, likely boosted by multiple factors including: net migration, the capacity of the residential building sector, a secular decline in inflation and bond yields, financial innovation and, more recently, the increase in financial system liquidity via quantitative easing (QE). Some of these drivers are now being reversed. This reversal argues against the prospect of a long-term upward trend continuing.
As at the end of October, New Zealand house prices have declined 12% from last year’s peak but remain almost 30% above their pre-COVID level. The current median New Zealand house costs $820,000 - more than 10 times the median household disposable income. Regional data shows much higher price-to-income ratios in Auckland relative to other regions. Nevertheless, the nationwide data implies a 30% decline in house prices is necessary to return this house price-to-income ratio to average, assuming no change in income. Alternatively, if prices don’t move, it would take seven years of 5% income growth to return the ratio to average.

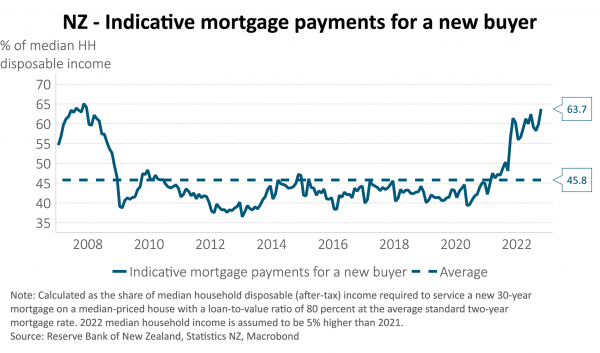
Perhaps what is more interesting than historic price-to-income ratios is the impact of higher interest rates on household capacity to make mortgage payments. Serviceability is a useful indicator in determining turning points in market behaviour. The current ability of a new buyer to finance a mortgage at prevailing mortgage rates is extremely low. It currently requires 64% of the median household disposable income to service a 30-year mortgage on a median house. For the new house buyer, house prices would need to decline by 28% for the mortgage servicing ratio to return to the 15-year average.

Relative to previous housing cycles, there are other negative dynamics at play, including:
- The cessation of the ability for property investors to offset mortgage interest costs against income for tax purposes; and
- Sharp increases in property maintenance and insurance costs.
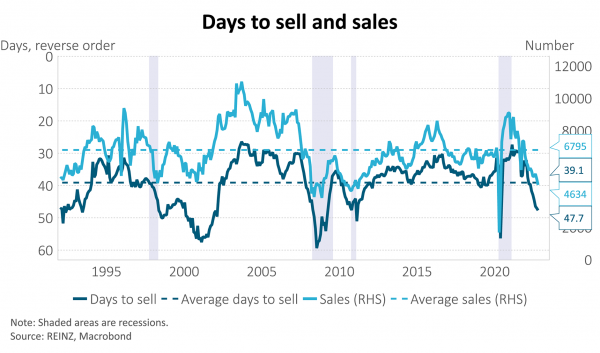
Market feedback points to significant weakness in the housing market as we near the end of 2022. Housing price falls seem set to continue into 2023, though the current high costs of building may slow the adjustment as potential new home buyers switch back into the existing stock of housing. Prevailing mortgage rates continue to increase and sit well above the average outstanding mortgage rate. Almost half of all outstanding mortgages will roll on to these higher rates over the next year. It is currently taking 48 days to sell a house, well above the historical average of 39 days. This figure has continued to extend in recent months. Despite a reduced number of properties being brought to market, actual sales are down 40%. This is a strong indicator that there is an overhang of stock.

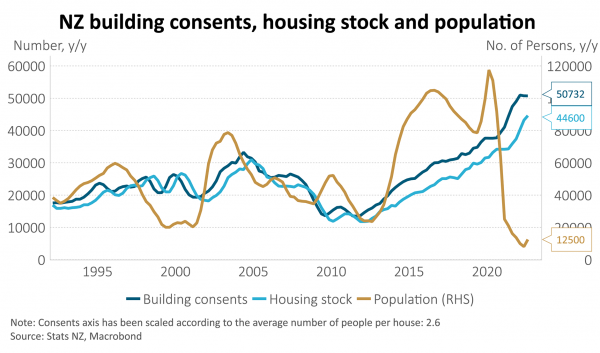
Thinking about the supply side, it is very difficult to determine when the New Zealand housing market was in equilibrium. The period 2014-2018 experienced significant population growth, a long way above the number of dwellings built. This began to reverse prior to COVID with excess construction accelerating over the past three years. This rise in construction has coincided with a collapse and reversal of migration, reducing population growth to almost zero. Consent growth has plateaued over the past three months and builders’ forward activity books indicate a private sector residential building cliff in H1 2023.
Overall, the chronic housing shortage that existed a few years ago has largely been solved. This has happened without New Zealand moving into a position of sharp oversupply, which created serious problems in Ireland, Spain and Florida after the Global Financial Crisis. A better sense of balance in the supply/demand in the market is also evident.
Many commentators have highlighted the weakness in the housing market, with bank economists among the first to place high risks going into 2023 for yet lower house prices and falling activity. Perhaps we are already well-progressed in the adjustment of house prices and the housing market, however, numerous indicators point to yet further pressures from:
- Low affordability
- Strong near-term building activity, and
- Low population growth.

Most periods of adjustment are measured in years and, in the absence of a significant change in incomes, interest rates or migration, the housing market may face further adjustment into 2023.
Important Notice and Disclaimer
This article is provided for general information purposes only. The information provided is not intended to be financial advice. The information provided is given in good faith and has been prepared from sources believed to be accurate and complete as at the date of issue, but such information may be subject to change. Past performance is not indicative of future results and no representation is made regarding future performance of the Funds. No person guarantees the performance of any funds managed by Harbour Asset Management Limited.
Harbour Asset Management Limited (Harbour) is the issuer of the Harbour Investment Funds. A copy of the Product Disclosure Statement is available at https://www.harbourasset.co.nz/our-funds/investor-documents/. Harbour is also the issuer of Hunter Investment Funds (Hunter). A copy of the relevant Product Disclosure Statement is available at https://hunterinvestments.co.nz/resources/. Please find our quarterly Fund updates, which contain returns and total fees during the previous year on those Harbour and Hunter websites. Harbour also manages wholesale unit trusts. To invest as a wholesale investor, investors must fit the criteria as set out in the Financial Markets Conduct Act 2013.
