| Investment markets generally have many different factors that drive returns, however occasionally there are very few. 2022 will go down as the latter. Inflation was the dominant theme for 2022, creating an unenviable backdrop for bond markets as central banks raised rates to try and combat rising inflation. Equity market valuations fell sharply adjusting to higher discount rates. |
While we pointed out the risk of inflation being more persistent in our risks and opportunities paper last year, we would be the first to admit that the magnitude of the increases was harder to foresee, as was the reaction across markets. Perhaps the scale of the market response reflected the strong consensus view in the market coming into 2022, which was that inflation, as some central banks also put it, was “transitory”. This serves as a good reminder that the greatest risks and opportunities in markets arise from consensus views, which ultimately prove incorrect and spur repricing.
Coming into 2023, the consensus is relatively downbeat. Scanning external research tells us that:
- Year-end equity price targets are flat to falling
- Inflation may take a long time to get back to 2%
- Investors are underweight tech stocks
- The US will have a mild recession in H2 2023
- China’s re-opening will be gradual, and
- Cash interest rates in New Zealand will almost hit 5.5% and remain there for some time.
Relatively bearish market sentiment gives rise to plenty of opportunities, but risks remain.
Here are our top 10 for 2023:
1. A much better backdrop for bond returns
2022 will go down as the worst year since the Global Financial Crisis for the 60% equities/40% bonds “balanced” portfolio. This has led to investors considering alternatives, particularly ones that can offset equity market risk. But just as investors are starting to lose faith in bonds’ role within portfolios, the forward-looking prospects for bonds are the best they have looked for years. The NZ Composite Bond Index currently has a running yield of c. 4.6%, while the Global Aggregate Bond Index yields 4.5% in New Zealand dollar hedged terms, (though it has touched over 5% in recent months). In terms of the Global Index, these recent levels of yield have not been seen since 2009.
We think that with central banks well into their tightening process, supply side inflation moderating, and demand softening, a backdrop is created for stronger bond returns compared to recent years. Importantly, bonds are now at yield levels where they have plenty of room to rally if a non-inflationary macroeconomic shock were to occur.
This more positive outlook for bonds may be tempered by the ongoing constraints of large budget deficits, a large supply of government bonds and growing government debt levels. Government fiscal deficits rose very sharply during the early and mid-stages of the COVID pandemic, leading to rises in public debt levels. The funding of larger debt issuance was essentially covered by central bank bond buying (QE). Now, governments are shifting towards a more frugal approach, but fiscal deficits look likely to remain quite high, partly due to the weaker economic cycle we are experiencing. In addition, central banks are now selling the bonds they had bought previously. QE is being replaced with Quantitative Tightening (QT). In combination, the private sector will be asked to buy considerably more government debt and that will be happening in a financial system with less liquidity chasing assets. Countries with weaker debt positions could come under some pressure and longer-dated government bonds across the world may see investors seeking a greater premium, limiting the scope for bond yields to decline as headline inflation falls back from peak levels.
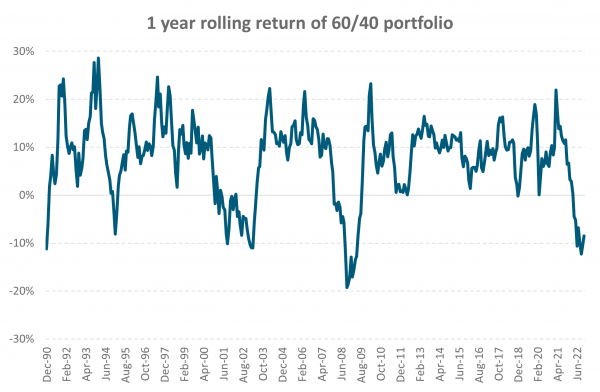
Source: Harbour, Bloomberg. 60/40 portfolio is a composite of: 40% MSCI ACWI Net Index (50% hedged),
20% S&P/NZX 50 Index, 20% Bloomberg NZBond 0+ Yr Index, 20% Bloomberg Global-Aggregate Bond Index (hedged to NZD).
2. From valuation risk to earnings risk
Over the longer term, the key driver of a company’s share price performance will be their ability to grow earnings. However, over the shorter term, earnings announcements news can be swamped by other factors such as valuations. 2022 was one of those years. The sharp increase in interest rate expectations gave rise to one the largest multiple contractions in modern history, though not one of the largest sell-offs due to earnings holding relatively firm. We expect share price performance in 2023 to be much more driven by earnings and, in our view, this could have significant implications for style and sector performance.
2022 has been a boon year for the more defensive utilities and healthcare sectors and a tougher one for longer duration stocks such as information technology, consumer discretionary and broader growth stocks. This is not lost on valuations nor positioning, which shows investors are largely underweight growth equity sectors and overweight defensives, as consensus market expectations seem to be that the global economy will fall into recession some time in 2023. With bottom-up consensus expectations compiled by Bloomberg at 8.3% earnings growth in the US and 8.7% in New Zealand, analyst expectations are yet to catch up to the deteriorating top-down view.
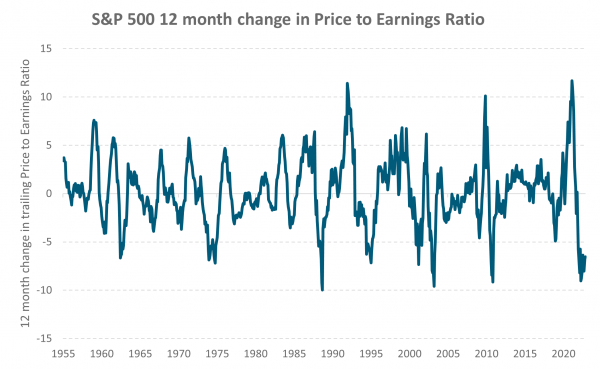
Source: Bloomberg, Harbour
3. New energy beats old energy
Europe has done well to avoid an energy crisis this northern hemisphere winter given the dramatic reduction in gas supply from Russia as it seeks to counter western sanctions associated with its invasion of Ukraine. Europe has successfully found alternative supply, and demand for gas has been reduced due to rationing and a warmer winter than normal (so far). While it looks likely that Europe will enter next winter with ample inventory, there are several risks that include a drop in temperature or a pick-up in global demand for gas as China reopens.
Europe’s efforts to increase their energy sovereignty has seen huge investment in renewables. On top on this, it has seen households reconsider their reliance on the grid. One way we can measure this is through tracking installations of rooftop solar. For example, Enphase Energy recently reported a 70% quarter-on-quarter increase in solar sales to Europe. Add in the US’s Inflation Reduction Act, which energy consultancy Wood Mackenzie estimates will increase total spending on renewables to US$1.2 trillion by 2035, and the future looks bright for new energy over old energy.
4. Geopolitical risks and opportunities: US increases sanctions on China, social pressures deliver positive change in autocracies
The ongoing US-China trade war has intensified in recent months after the US announced sanctions targeting China’s use of semi-conductors within its manufacturing process. China’s increasingly assertive stance towards “re-unification” with Taiwan and greater US desire to keep US technology out of Chinese military systems may lead to an expansion of some sanctions in 2023 and a further deterioration in the US-China trading relationship. As 2022 has proved once again, sanctions are often inflationary, and history tells us they often stick around for longer than the conflict itself. We have also observed that, through time, equity risk premia have exhibited a strong correlation to geopolitical uncertainty. So, to somewhat state the obvious, these would be unwelcome developments for equity markets.
There is geopolitical opportunity, however, if ongoing social pressure delivers positive change in autocracies. Protests in China, Iran and, to a degree, in Russia have been widely covered in the western press, while in each of these countries state-controlled media has worked hard to downplay underlying dissatisfaction. It is conceivable that as pressures mount gradual change may deliver better outcomes for the supply-side of economies. At the most positive end of the scale, in Russia, dissatisfaction with the war in Ukraine seems to be gradually increasing. A resolution of the war could provide a significant change in the energy and food sectors. Equally, tensions in the geopolitical arena could just as easily deteriorate and investors will need to be attuned to points of tension.
5. China fully re-opens
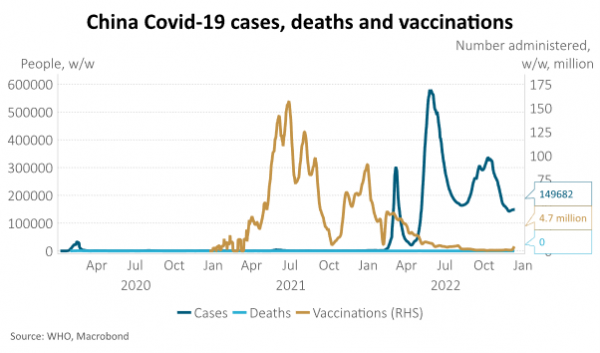
Until recently, most analysts had expected a very slow removal of COVID-19 restrictions in China, such that 2023 economic growth would be better than this year but not impressive. Recent policy announcements, however, suggest increased appetite to re-open more quickly. It also appears that the Chinese SINOVAC vaccine may be more effective than previously thought in protection against severe illness or death.
However, full re-opening of the Chinese economy likely requires a greater vaccination rate of the elderly and vulnerable. Should this happen quickly, economic growth next year could be as much as 6%, concentrated in H2, rather than the 4.5% expected prior to the recent announcements. This has important implications for both the health of the world economy next year (with China making up roughly 20% of global GDP), and New Zealand’s economic prospects (as China is our largest trading partner, taking about one third of all exports).
6. The global economy enters recession
Most economists expect a period of below-potential global economic growth next year rather than recession. In numbers, this equates to 2% growth in 2023, versus a long-term average of 3.5%. The view of some growth, rather than a recession, rests on an assumption that household balance sheets are strong and labour markets will remain tight enough to provide ongoing income growth as a partial offset to the negative impact of higher interest rates.
The risk, however, is that just as the reopening impulse fades in economies like the US, tight monetary policy bites much harder than expected and pushes the global economy into recession. The peak impact of changes in monetary policy occurs after approximately 18 months. Most central banks anticipate further rate hikes, but housing markets already appear to be negatively responding to large increases in mortgage rates. Prices are falling, sales are slowing, affordability is poor and residential investment is likely to decline considerably. Next year a housing and consumer-led recession could be exacerbated by Europe’s delayed energy crisis.
7. The US achieves a soft landing
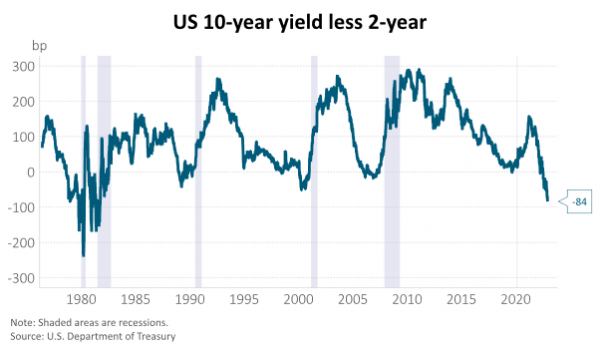
Financial markets are pricing a high probability of a US recession next year. The US yield curve is the most inverted since the early 1980’s with 10-year yields sitting more than 80bps below 2-year yields. The implied volatility of US Treasuries is 90% of the average level seen in the past four US recessions.
The US Federal Reserve, however, believes a soft landing is possible where inflation returns to 2%, job losses are minimal, and a recession is avoided. Indicators suggest inflation is already heading lower, but the labour market remains the sticking point. There are currently 1.7 job openings for every unemployed person in the US. A soft-landing hinges on the Fed’s ability to calibrate policy that will result in higher interest rates, reducing firms’ profitability and demand for labour to better match supply - but not forcing firms to shed labour.
8. The USD weakens
USD strength through 2022 surprised many as the currency overcame concerns about twin current account and fiscal deficits in the context of overvaluation. Instead, the USD was supported by widening interest rate differentials with the rest of the world along with its safe-haven characteristics of high-quality institutions and deep capital markets. For those holding US equities on an unhedged currency basis, this provided a useful partial offset to negative equity returns.
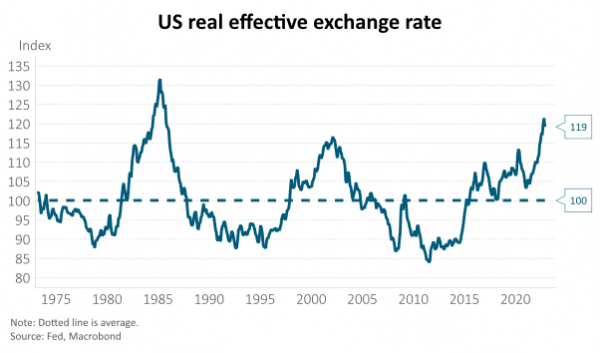
Most analysts expect the USD to strengthen in Q1 and slowly depreciate over the remainder of the year, to be largely unchanged from current levels. The risk, however, is that the cyclical drivers of USD strength give way to concerns about overvaluation in 2023. On a purchasing power parity basis, the USD is overvalued against 9 of the 10 G10 currencies and by as much as 85% in the case of the JPY. On a real trade-weighted basis the USD is almost 20% above its 50-year average.
A weaker USD may help reduce tradable inflation pressures outside the US by making goods denominated in USD cheaper. For emerging markets, where a large amount of debt is USD-denominated, it reduces the local currency size of this, helping to lower the external vulnerability of these countries. For investors outside the US, a weaker USD may reduce US equity returns if these are held without a currency hedge.
A soft landing is far from consensus. Investor positioning appears to be pricing in a US recession. We can observe the low valuations relative to history for cyclical stocks and relative to less cyclical, defensive stocks. Additionally, the more conservative stance towards equities overall is also reflective of the consensus outlook being one where a recession is expected. If a soft landing (while bringing down inflation) is achieved, this would be a significant positive for markets overall and could lead to a re-allocation towards cyclicals and away from defensives.
9. The RBNZ keeps policy tight for longer than expected
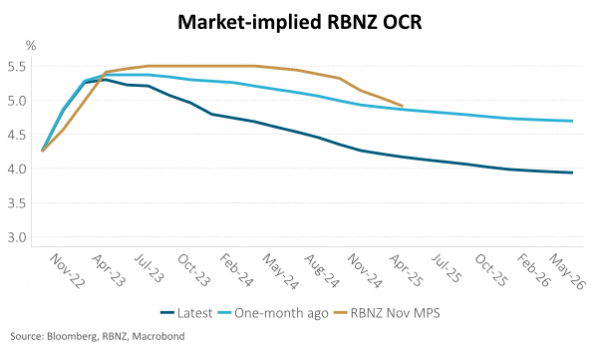
New Zealand financial markets don’t believe the RBNZ forecasts for the OCR to be above 5% for all of 2023 and 2024. Instead, markets assume after reaching a peak of 5.4% in May next year, broadly in line with the RBNZ forecast peak of 5.5%, that the OCR will be cut more than 100bp by the end of 2025. The risk, however, is that the RBNZ forecasts turn out to be what is required to sufficiently loosen the labour market and return inflation to target – at the expense of economic growth. Core inflation and inflation expectations are sitting well above the top of the RBNZ’s 1-3% inflation target band. The labour market remains tight and average hourly earnings are growing at 8.5% y/y. It is not clear how quickly a pick-up in net migration might help alleviate these pressures.
An alternative scenario is where the monetary policy transmission mechanism works much better than the RBNZ is currently assuming, reducing the need to take the OCR as high as 5.5% and possibly leading to a larger easing cycle than markets currently assume from H2 2023.
10. House prices decline by more than expected
Most economists (including the RBNZ) expect the peak to trough decline in New Zealand house prices at around 20%. Just over half of that decline has already occurred, as very low rates of population growth, high mortgage rates and ongoing increases in housing supply have overwhelmed the positive influence of a tight labour market. This dynamic is likely to continue through 2023.
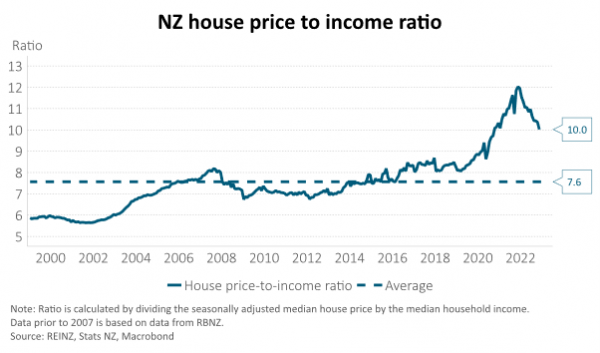
Extremely poor affordability, however, suggests downside risks to house prices. House price-to-income ratios and mortgage repayment costs, for example, require a further 30% decline in house prices to return to long-term averages (all else equal).
A larger-than-expected decline in house prices will likely contribute to a larger economic recession next year as the incentive to invest in residential housing is lessened and consumers’ appetite to spend is reduced via a negative housing wealth effect. The RBNZ already anticipates a 1% contraction in economic activity starting from Q2 next year. There is also a more benign scenario for the housing market where house affordability slowly improves via ongoing income growth, reducing the pressure for house prices to fall.
Important Notice and Disclaimer
This article is provided for general information purposes only. The information provided is not intended to be financial advice. The information provided is given in good faith and has been prepared from sources believed to be accurate and complete as at the date of issue, but such information may be subject to change. Past performance is not indicative of future results and no representation is made regarding future performance of the Funds. No person guarantees the performance of any funds managed by Harbour Asset Management Limited.
Harbour Asset Management Limited (Harbour) is the issuer of the Harbour Investment Funds. A copy of the Product Disclosure Statement is available at https://www.harbourasset.co.nz/our-funds/investor-documents/. Harbour is also the issuer of Hunter Investment Funds (Hunter). A copy of the relevant Product Disclosure Statement is available at https://hunterinvestments.co.nz/resources/. Please find our quarterly Fund updates, which contain returns and total fees during the previous year on those Harbour and Hunter websites. Harbour also manages wholesale unit trusts. To invest as a wholesale investor, investors must fit the criteria as set out in the Financial Markets Conduct Act 2013.