Key Points
- Housing affordability continues to be a major challenge for many households. Initiatives to increase supply and to manage risks to the financial system have helped to contain house price rises, but they have not been able to hold the market back from strong price gains across the country. Our analysis had suggested that house prices could keep rising in the near term, supported by falling mortgage rates and a buoyant economy. However, risks of price declines are growing. The coronavirus outbreak has elevated the risks.
- The drivers of strong price gains over recent years have been positive migration, falling mortgage rates and strength in the jobs market. We see limited scope for these factors to add to housing market strength over the medium term. Coronavirus could be a catalyst for weaker prices if the economic impact is significant and unemployment increases.
- Prior to COVID-19 we had considered whether a housing market bubble might exist. We judged that this was not the case, although some traditional features of bubbles are apparent.
- Recently announced policy responses from the Reserve Bank of New Zealand and our Government are meaningful and we expect them to mitigate risks to a considerable degree. The key issues for housing will be the jobs market and whether any mortgage payment flexibility is forthcoming.
The expensive housing market – risks and challenges for all of us.
Houses are very expensive. The traditional measure of the median house price as a ratio of median household income is at extreme levels by both domestic and international norms. However, lower mortgage rates have meant that servicing mortgages is roughly comparable with long-term averages.
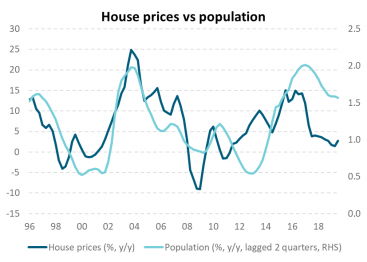
For the last 30 years, house prices have been driven by mortgage rates, population growth and the unemployment rate. Central bank and government policies have provided some offset. Loan to Value Ratio (LVR) limits, the foreign buyer ban and discussion of capital gains tax all had a negative impact on prices.
As we enter a new decade and contemplate what it may have in store for us, one aspect of our life in New Zealand looks all too familiar. The houses we live in, or aspire to live in, are increasingly expensive. New home buyers are faced with a daunting leap of faith and worry that prices will just keep rising. Every now and then the market faces a fresh hurdle but, after a pause, the market has found a way to continue appreciating. One can’t help but wonder what it might take to cause a meaningful fall in prices.
Housing is a major part of the domestic economy. In this note, we identify the underlying drivers of house prices and assess whether economic fundamentals justify current prices. We also consider whether house prices are in a bubble. Then we describe how the market may evolve over the next 6-24 months.
Our take is that house prices are justified by key drivers such as low mortgage rates, low unemployment and continued population growth. The market could easily continue with strong momentum over the next few months, but risks are gradually building. Identifying bubbles isn’t simple but, by our measures, only some of the criteria to claim we are in bubble territory are met. We think the bigger risk to housing comes not from a bubble bursting, but from a reversal of the drivers that pushed prices higher in the first place.
Valuations and affordability: Definitely expensive but mortgage servicing is not more onerous.
House prices have risen by 5.2% p.a. since 2007, while median income growth has only averaged 3.6% p.a. over this time. The median house price was 4 times New Zealand’s median household income[1] in 2000; it’s now 6.6 times. For Aucklanders this ratio is 8.7 times.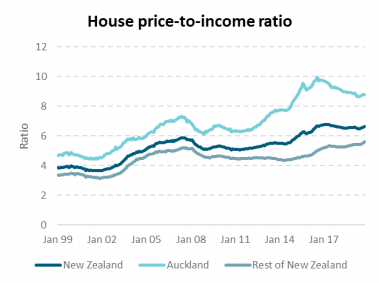
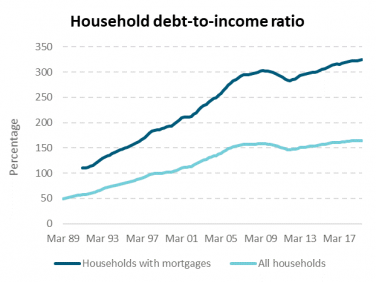
Source: REINZ, Stats NZ, REINZ estimates
Our mortgages are bigger too, rising from 190% of household income in 2000 to 320% in 2019. But of course, mortgage rates have fallen sharply. This is so much so that, perhaps surprisingly, mortgages payments are in line with historical averages, requiring around 30% of income to service. For new buyers, it is perhaps finding the initial deposit that is the first and biggest hurdle. That is especially the case for those with student loans.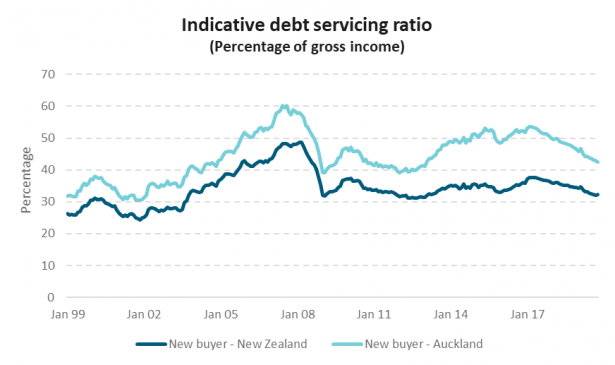
Source: REINZ, Stats NZ, interest.co.nz, RBNZ estimates.
Note: New buyer with an average income buying at the average house price with a 20 percent deposit.
In New Zealand people are also aware that house prices have generally been rising in other countries. Certain hotspots, such as central London or Vancouver, get plenty of press coverage. However, New Zealand prices have climbed further than other countries we have historically compared ourselves with.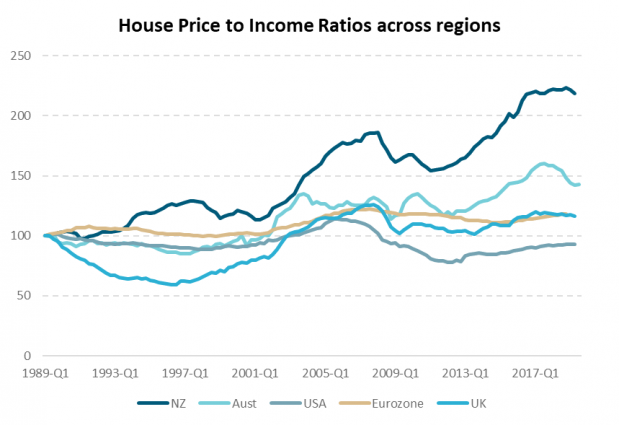
Source: OECD (2020), Housing prices (indicator). doi: 10.1787/63008438-en (Accessed on 21 February 2020)
A house price model: Does a good job of estimating prices.
Most people would assume that the housing market is influenced by a range of factors. However, they might not agree on what matters the most and would be surprised that prices might not be far from fair value at present, based on a regression model that captures statistically significant drivers. Our model identifies 3 persistent variables that describe house prices since 1996 – population growth, the change in mortgage rates and the unemployment rate. It also shows that certain one-off events have had a negative impact on house prices: The Global Financial Crisis (GFC) was one; LVR restrictions imposed by the Reserve Bank was another. In addition, foreign buyer restrictions/capital gains tax proposals (which occurred around the same time and cannot be separated as influences) also had an impact. Interestingly, measures of supply such as construction growth (proxied by building consents) exhibit a positive relationship with house prices. However, this may be because there has been a persistent shortfall in housing supply that has never been filled. In the mid 2000’s excessive supply in Spain, Ireland and Florida all added to the fall in prices that occurred during the GFC.
NZ house price model estimates (Q1 1996 – Q3 2019)
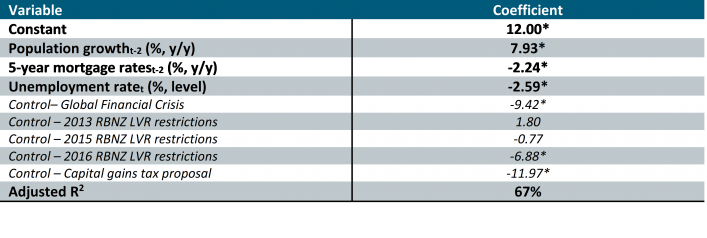
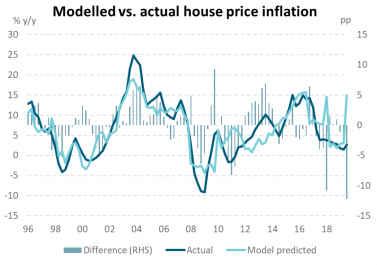
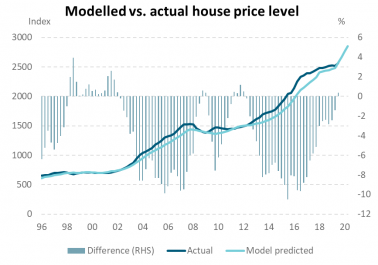
Statistically the R2, at 67% and a measure of model fit, suggests our identified variables do not tell the whole story. However, the model makes intuitive sense and provides a framework for assessing the housing market.
Source: Bloomberg, Reserve Bank of New Zealand.
An interesting aspect of the regression is that changes in mortgage rates impact with a 6-month lag. While this is not surprising, it suggests that recent mortgage rate declines have not yet had their full impact. Our model suggests house prices were slightly undervalued as at Q3 2019 and that last year’s population growth and large reductions in mortgages rates should push house price inflation to c.12% y/y in this quarter, from c.3% y/y in Q3 of last year. Recent monthly house price data from the Real Estate Institute of NZ (REINZ) supports this finding as its comparable index increased 8.6% y/y in February.
What next? So, if the model does a decent job, what drivers are currently at play and how might they manifest themselves?
Mortgage rates:
Not surprisingly, mortgage rates have been a significant driver of house prices. The large secular decline in mortgage rates that we have seen globally over the last 30 years has had a powerful impact. Currently, mortgage rates are at all-time lows and the Reserve Bank has now cut the Official Cash Rate (OCR) to 0.25% and pledged to hold the rate there for a year in an effort to avert the anticipated coronavirus shock to the economy.
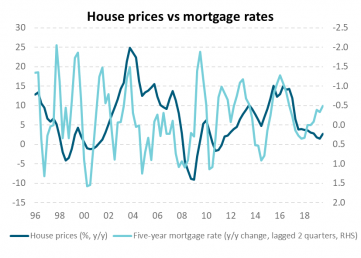
Source: Bloomberg, Reserve Bank of New Zealand.
Credit Availability (not captured in our model):
While mortgage rates will always be highly correlated with actual (and anticipated) monetary policy decisions, there are other factors at play. The motivation of banks to lend to the mortgage market is an important consideration. There have been two notable dynamics affecting bank behaviour recently. Firstly, the Australian Prudential Regulation Authority (APRA), responsible for bank regulation, requires banks to put aside capital when it makes any loan and the amount of capital required depends on the perceived riskiness of the lending. As mortgages are deemed to be fairly low risk, the capital requirement imposed on the Australian bank (and by default their New Zealand subsidiaries) is lower than general corporate lending. Banks will generally channel funds into sectors where they get a better return on capital and mortgages are an attractive sector, given the lower capital requirement. Consequently, banks have been quite willing mortgage lenders over recent months. (See chart below). We see this manifesting itself in competitive mortgage rates, when compared to underlying wholesale swap rates.
Secondly, as the banks have increased their lending, deposit growth has slowed. As rates have fallen, savers have looked elsewhere to generate returns. This phenomenon looks structural if you assume that interest rates will stay low. For banks, term deposits make up a very large part of total funding. While other funding sources, such as selling bonds offshore are also available, these have limits. Ultimately, if term deposit growth remains modest, banks will be forced to lift term deposit rates, tighten lending availability or lift mortgage rates. The last two of these choices should have a constraining impact on the housing market.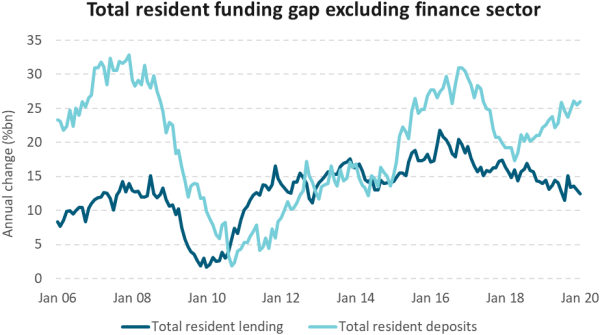
Source: RBNZ, ANZ Research
Population growth: Government policy dependent.
New Zealand’s population is ageing and net migration over the last decade has been historically high, particularly post-GFC, when the Government saw this as a policy that could help underpin growth. Most economists, including the RBNZ, don’t expect these high rates of net migration to continue. We expect positive, but slower population growth in future years. This supports house price growth, but to a lesser degree.
Unemployment: Limited scope for further support, downside risks exist.
The unemployment rate has trended down steadily since the GFC, when it peaked at 6.7%, and currently sits at 4.1%. The jobs market is now tight and high job security has supported house prices, as buyers will be more confident about their ability to service mortgage payments. While we wait to see what economic damage accrues from Coronavirus, it is likely that jobs are lost in the tourism sector. A more widespread loss of employment would put pressure on debt servicing and could hurt the housing market. This is certainly a risk to consider.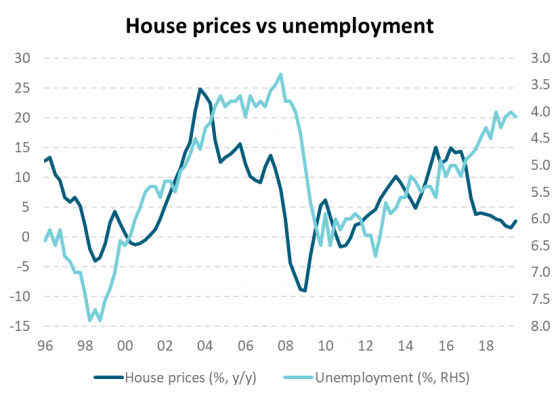
Source: Bloomberg, Reserve Bank of New Zealand.
One-off factors: The GFC, LVR restrictions, capital gains tax proposals, foreign buyer rules.
We have seen a range of one-off factors have a distortionary effect on the housing market. While the GFC can be more accurately categorised as an economic and financial event that was just more extreme than usual, it is useful to control for the potential distortion to our model estimates. For example, failing to control for the GFC reduces the explanatory power of the model. The first two rounds of RBNZ LVR restrictions at the end of 2013 and 2015 don’t test as significant which may relate to house price inflation at the time being concentrated in Auckland, rather than nationwide. The third round of LVR tightening in 2016 tests as significant. The capital gains tax proposals and foreign buyer rules occurred at the same time and therefore are captured as one control variable that is statistically significant. Regardless of the way they are captured in our regression model, the key point is that they most of these events have had a dampening effect on prices. Our model suggests house prices would be even higher without these factors occurring.
Is there a housing bubble?
Recently the media has become more focused on housing. Affordability and homelessness are significant social and political issues. The initial aim of our research was to determine how expensive housing has become and see if bubble conditions were emerging that might suggest that at some point prices could correct sharply. In the table below we run through a checklist[2] of indicators that characterise episodes of bubbles observed in asset markets.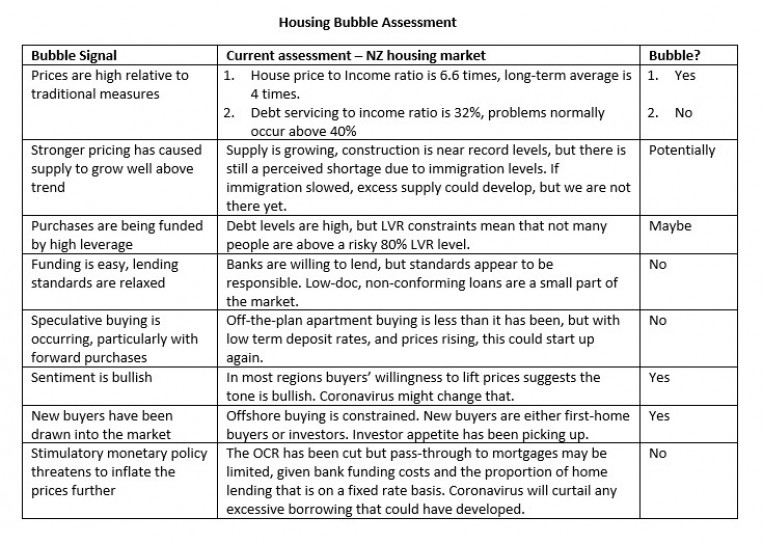
On balance, we do not seem to be in a clear bubble. However, we can identify developments that could conceivably lift the market into bubble territory. If for instance, construction continued aggressively while immigration slowed, the shortage of supply would be satisfied. If through that time, prices rose as investors chased properties in a move away from term deposits, we might have a combination of events that heightened risks. Countering these risks, it is possible that the Reserve Bank tightens LVR rules, or banks lift mortgage rates due to funding challenges, thereby calming the market before prices lifted much further.
Our biggest concern and investment implications:
The Coronavirus outbreak over recent weeks presents the most obvious near-term risk to the New Zealand economy and one would expect housing to be affected if we experience an extended period of weakness. Firstly, we would emphasise that the economy has shown good momentum lately and that we go into COVID-19 with a degree of resilience. If the impact of the virus turns out to be short-lived, such that by mid-year we have seen the worst, then housing should sail through relatively calmly.
However, if we suffer a deeper slowdown, especially if that is accompanied by widespread job losses, then housing could face a bigger challenge. Job losses are perhaps the toughest challenge, as mortgage servicing relies on income. While this scenario is purely speculative at present, uncertainty around the ability to contain coronavirus and the economic impact are still far from certain.
Investment implications:
Up until now, house price momentum had been strong and there is a possibility that mortgage rates ease in response to the recent RBNZ rate cut. However, the coronavirus outbreak has already prompted a sharp fall in equity markets, a big rally in bond markets and some signs of anxiety in credit markets. Additional policy responses, in the form of government support, are being delivered and more is possible.
If the housing market is caught up in ongoing weakness, there are various investment sectors that could specifically be impacted. We list these as sectors that could face pressure if we face considerable stress.
- Bank subordinated debt: Since the GFC, the Reserve Bank has launched a handful of measures to improve the stability of the financial system and we are convinced that it is much more resilient than it was 10 years ago. However, risk has not been banished altogether. The requirement to fund offshore leaves banks exposed to any high stress globally, if that means funding markets shut for an extended time. The GFC showed that bank sub-debt is more susceptible to credit market concerns.
- Mortgage-backed securities: There is not a large volume of MBS deals outstanding in the New Zealand market and lending criteria have tightened since the GFC. Nonetheless, this would be an area of focus, given our memories of the GFC.
- In a time of greater stress, the credit market would also face diminished liquidity and probably underperformance of credit in favour of high-grade credit and government stock.
- More generally, the prospect of slower house price growth over the next few years will create challenges for savers looking to grow their investments and generate income. Income levels, net of costs, from investment properties will become a strong focus if capital gains diminish.
Summary
In summary, housing has had a tremendous run over the last 30 years. The drivers of that growth, being lower interest rates, population growth and falling unemployment, can only provide marginal fresh impetus from here. The spread of coronavirus, which has led to aggressive containment decisions, seems likely to weaken the New Zealand economy considerably in 2020. Over the next year, credible support from the Government will be required to soften the blow. Even if support policies are successful, we expect house price growth to be modest in the years ahead.
==========================================================================================
Technical appendix – Modelling NZ house prices
We adopt a demand-based approach to explaining movements in NZ house prices. Using quarterly data from Q1 1996, we model annual changes in Quotable Value New Zealand (QVNZ) nominal house prices as a function of annual population growth (![]() ), the annual change in 5-year mortgage rates (
), the annual change in 5-year mortgage rates (![]() ) and the unemployment rate (
) and the unemployment rate (![]() ). We find the change in mortgage rates explains more of the variation in house prices than the level of mortgage rates. Different mortgage tenors don’t materially impact our results. We initially allow explanatory variables to enter contemporaneously and with lags of up to 6 quarters. We refine the lag structure by removing variables that have unintuitive coefficient signs (i.e. those that are negative for population growth, positive for mortgage rates and unemployment) and by choosing the lags with the greatest statistical significance. We attempted to control for housing affordability by including the house price-to-income ratio and, alternatively, the household debt-to-income ratio but coefficient signs on both were either unintuitive (i.e. positive) or insignificant. Measures of supply, such as construction growth (proxied by building consents), were not included because they exhibited an unintuitive positive relationship with house prices, likely reflecting the persistent shortfall in NZ housing supply over our sample period.
). We find the change in mortgage rates explains more of the variation in house prices than the level of mortgage rates. Different mortgage tenors don’t materially impact our results. We initially allow explanatory variables to enter contemporaneously and with lags of up to 6 quarters. We refine the lag structure by removing variables that have unintuitive coefficient signs (i.e. those that are negative for population growth, positive for mortgage rates and unemployment) and by choosing the lags with the greatest statistical significance. We attempted to control for housing affordability by including the house price-to-income ratio and, alternatively, the household debt-to-income ratio but coefficient signs on both were either unintuitive (i.e. positive) or insignificant. Measures of supply, such as construction growth (proxied by building consents), were not included because they exhibited an unintuitive positive relationship with house prices, likely reflecting the persistent shortfall in NZ housing supply over our sample period.
Our final specification models house price changes as a function of population growth with a lag of two quarters, the change in 5-year mortgage rates with a lag of two quarters, and the contemporaneous unemployment rate. We control for potential distortion caused by the Global Financial Crisis (GFC) by including a control variable for the period Q1 2008 to Q4 2009 (![]() ). We include three control variables to ameliorate potential distortion from Reserve Bank of New Zealand (RBNZ) Loan-to-Value Ratio (LVR) restrictions introduced in October 2013 (Q4 2013 to Q4 2014,
). We include three control variables to ameliorate potential distortion from Reserve Bank of New Zealand (RBNZ) Loan-to-Value Ratio (LVR) restrictions introduced in October 2013 (Q4 2013 to Q4 2014, ![]() ) and then tightened at the end of 2015 (Q4 2015 to Q4 2016,
) and then tightened at the end of 2015 (Q4 2015 to Q4 2016, ![]() ) and 2016 (Q4 2016 to Q4 2017,
) and 2016 (Q4 2016 to Q4 2017, ![]() ). We also control for the period where the NZ government was considering a capital gains tax (Q2 2018 to Q2 2019,
). We also control for the period where the NZ government was considering a capital gains tax (Q2 2018 to Q2 2019, ![]() ) - a period that also coincided with the introduction of a foreign buyer ban in October 2018. The full equation is as follows:
) - a period that also coincided with the introduction of a foreign buyer ban in October 2018. The full equation is as follows:
![]()
The results reported above show that population growth, mortgage rates and the unemployment rate are statistically significant determinants of house prices. Control variables for the first two rounds of RBNZ LVR restrictions do not test as significant which may relate to house price inflation being concentrated in Auckland at this time. All other control variables are significant. Failing to control for the GFC reduces the explanatory power of the model. The removal of the RBNZ LVR restrictions control variable reduces the coefficient on population growth, lowering the explanatory power of the model. Failing to control for the proposed capital gains tax reduces the explanatory power of the model.
Over our sample period, the model underestimates the high house price inflation seen between 2003-2007 and again between 2013-2016. The model overestimates house price inflation following the GFC and since 2017.
[1] Note: The median house price to median household income ratio is a widely used indicator of affordability. At first glance one might expect this to remain fairly steady over time. If incomes grow, then people can afford to pay more for a house. However, as interest rates have trended lower over the last 30 years, one should also look at debt serviceability ratios. Looking at both of these indicators gives a more complete picture.
[2] Spotting Bubbles: We have compiled a list of asset bubble indicators, selecting from various sources. This includes Ray Dalio Principles for Navigating Big Debt Crises, 2018.
IMPORTANT NOTICE AND DISCLAIMER
Harbour Asset Management Limited is the issuer and manager of the Harbour Investment Funds. Investors must receive and should read carefully the Product Disclosure Statement, available at www.harbourasset.co.nz. We are required to publish quarterly Fund updates showing returns and total fees during the previous year, also available at www.harbourasset.co.nz. Harbour Asset Management Limited also manages wholesale unit trusts. To invest as a Wholesale Investor, investors must fit the criteria as set out in the Financial Markets Conduct Act 2013. This publication is provided in good faith for general information purposes only. Information has been prepared from sources believed to be reliable and accurate at the time of publication, but this is not guaranteed. Information, analysis or views contained herein reflect a judgement at the date of publication and are subject to change without notice. This is not intended to constitute advice to any person. To the extent that any such information, analysis, opinions or views constitutes advice, it does not consider any person’s particular financial situation or goals and, accordingly, does not constitute personalised advice under the Financial Advisers Act 2008. This does not constitute advice of a legal, accounting, tax or other nature to any persons. You should consult your tax adviser in order to understand the impact of investment decisions on your tax position. The price, value and income derived from investments may fluctuate and investors may get back less than originally invested. Where an investment is denominated in a foreign currency, changes in rates of exchange may have an adverse effect on the value, price or income of the investment. Actual performance will be affected by fund charges as well as the timing of an investor’s cash flows into or out of the Fund. Past performance is not indicative of future results, and no representation or warranty, express or implied, is made regarding future performance. Neither Harbour Asset Management Limited nor any other person guarantees repayment of any capital or any returns on capital invested in the investments. To the maximum extent permitted by law, no liability or responsibility is accepted for any loss or damage, direct or consequential, arising from or in connection with this or its contents.
